1. Data Description
Our dataset - Home Equity (HMEQ) - was given to us by the client, containing 12 predictors and 1 target variable BAD (0: not defaulted, 1: defaulted). The dataset consists of 5690 observations, with 4,771 non-defaulters and 919 defaulters. Details of the dataset are as follows:
BAD: Target variable indicating loan default status (0: not defaulted, 1: defaulted).LOAN: Amount of the loan request.MORTDUE: Amount due on existing mortgage.VALUE: Value of current property.REASON: Reason for loan (DebtCon: debt consolidation, HomeImp: home improvement).JOB: Job status of applicant.YOJ: Years at current job.DEROG: Number of derogatory reports.DELINQ: Number of delinquent credit lines.CLAGE: Age of oldest credit line in months.NINQ: Number of recent credit inquiries.CLNO: Number of credit lines.DEBTINC: Debt-to-income ratio.
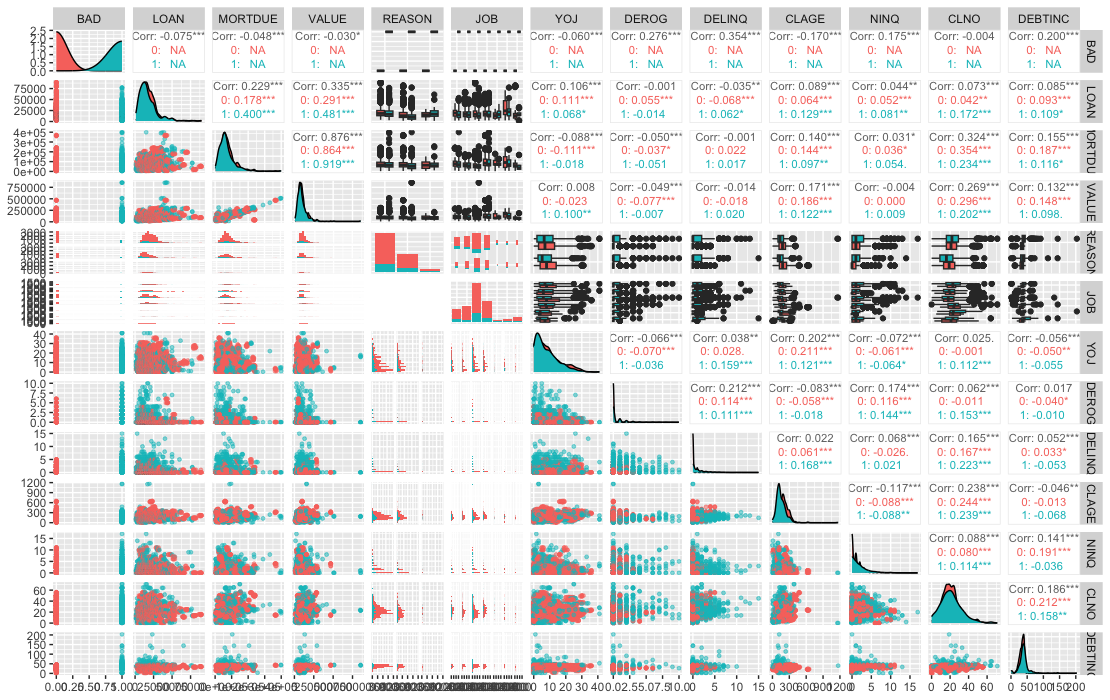
2. Correlation Matrix
The correlation matrix below illustrates relationships between variables in the dataset and their interactions within each class of the target variable, BAD. Pearson correlation results help identify which variables are most effective for class discrimination. Additionally, multicollinearity—where predictors are highly correlated and can negatively impact model performance—is detected through these pairwise distributions.
3. Nullity Analysis
Given the nature of household data, missing values are unavoidable and may even carry informative value. Therefore, appropriate imputation is essential to prevent bias in the model. Additionally, to ensure the reproducibility of our scorecard, the imputation algorithm will be included as part of this project’s deliverables.
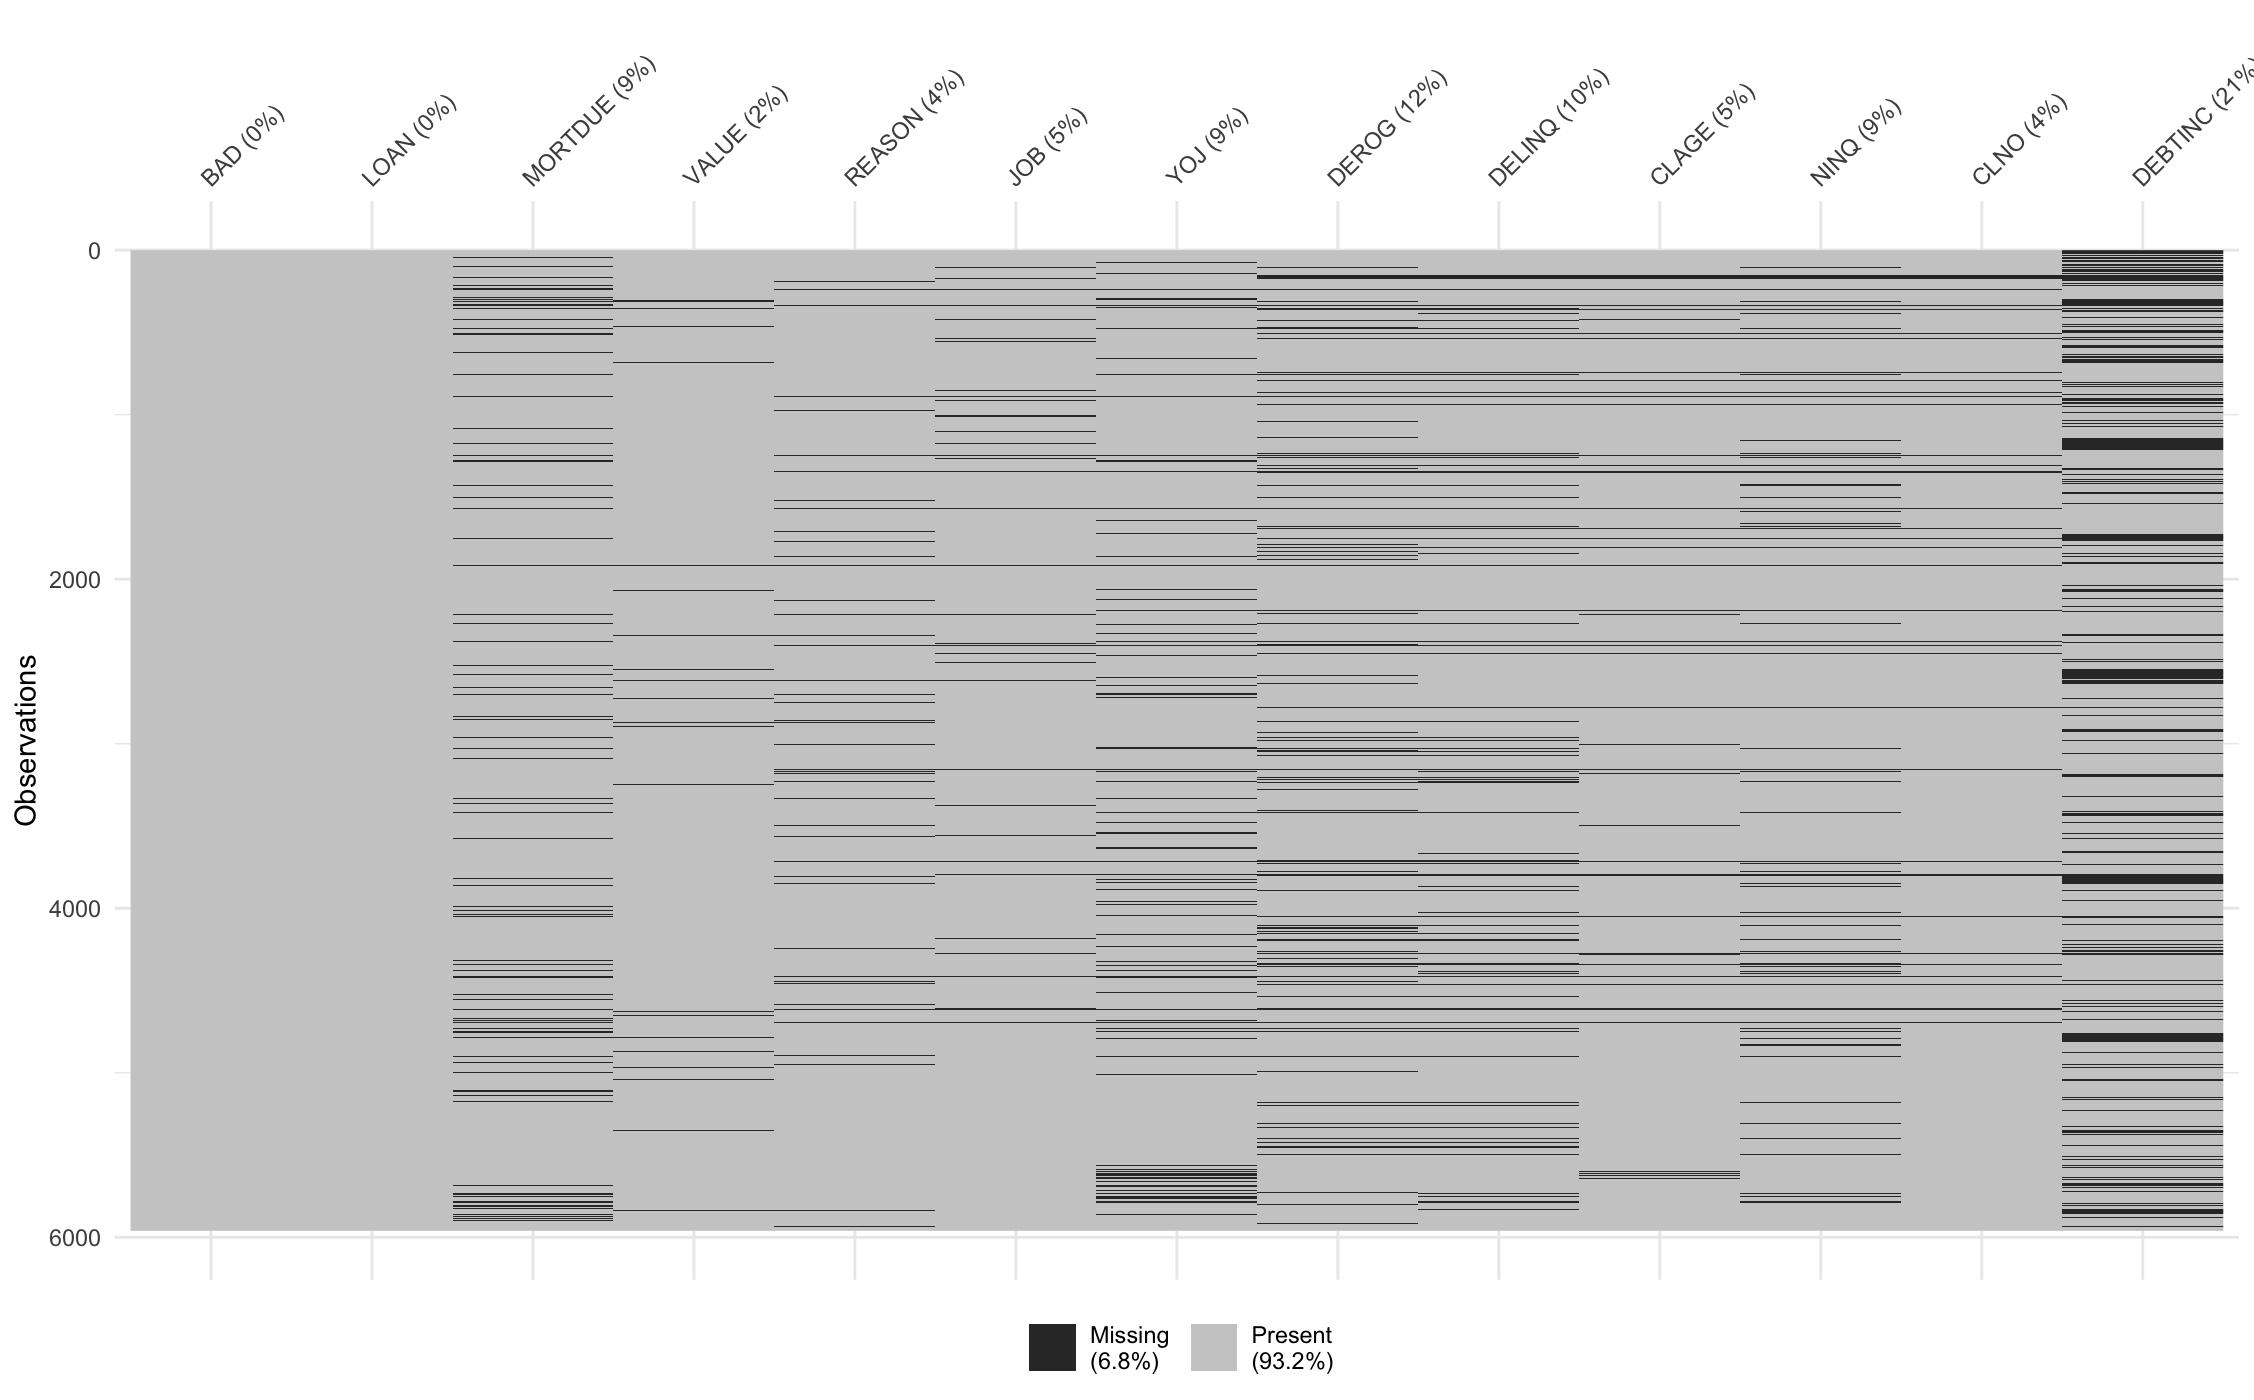
BAD has none.Given our dataset and the specific requirements of this project, we encounter several challenges:
Imbalanced data: with 4,771 observations under
BAD = 0(no default) and 919 underBAD = 1(loan defaults). This imbalance could lead to model bias, requiring careful handling during the modelling process.Missing Values: Missing data may hold informative value, proper imputation techniques are necessary to ensure they do not introduce bias into the model.
Interpretability: To maintain the interpretability essential for scorecard construction, number of predictors used in modelling must be reduced to a manageable level. Also our modelling options are limited to logistic regression, decision trees, or generalised additive models (GAMs).